Making Obsidian even better with some handy extensions
2024-10-19
About 4 weeks ago I wrote about switching to Obsidian as my sole note-taking software for university and
I couldn't be happier so far. It is reliable, easy to use and most importantly customizable beyond
belief - all of these characteristics combined in one package make for a truly amazing experience.
Combine that with virtually no vendor lock-in due to it only using Markdown files and folders for
storage and I have to admit I'm already quite addicted. Of course, I also came across some more handy
plugins besides the ones I already mentioned (
Editing Toolbar
,
Excalidraw
and
Iconize
) in the meantime, so let's talk about them for a bit...

First and foremost, I started to miss the ability to easily plot function graphs like I was used to via
the LaTeX integration of Xournal++. Thankfully, multiple extensions exist for this job and I can even
recommend two of the ones I tested -
Desmos
and
Obsidian Functionplot
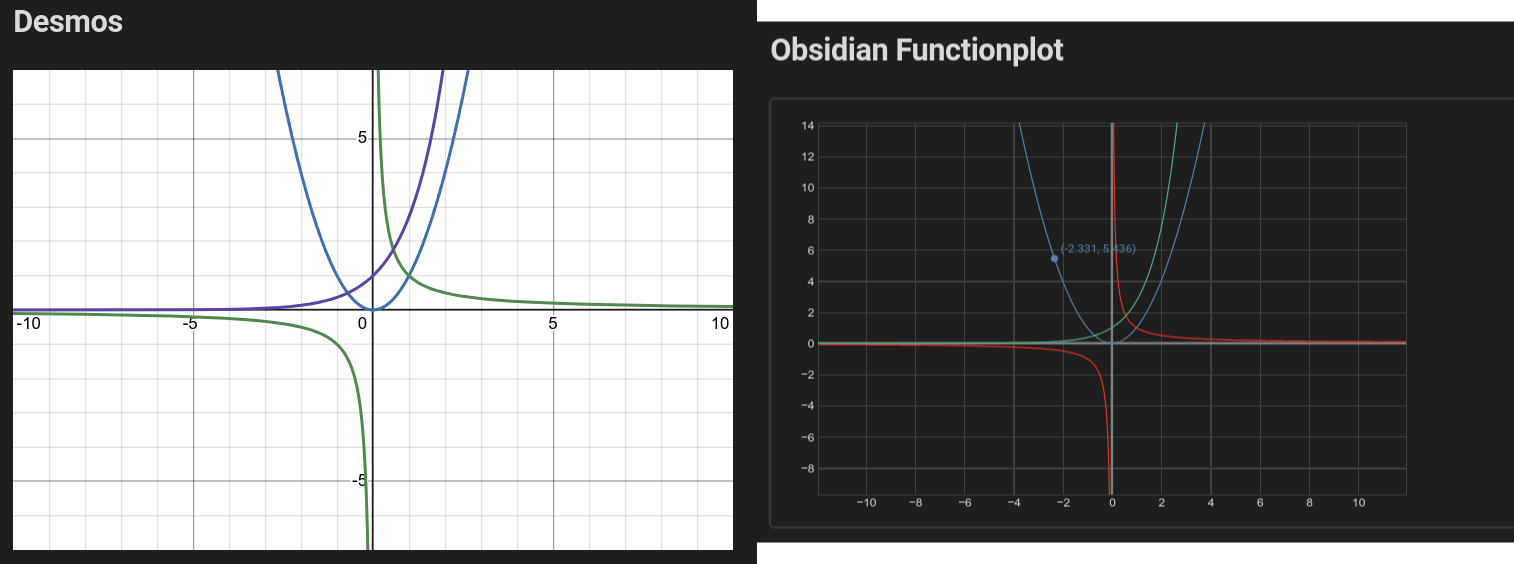
. Both of these offer you the ability to simply enter one or multiple functions into a code block with
the language set to
desmos-graph
or
functionplot
respectively and immediately create beautiful function graphs. You can optionally tweak the shown area
and do some more modifications, but for the most part these look amazing out-of-the-box.
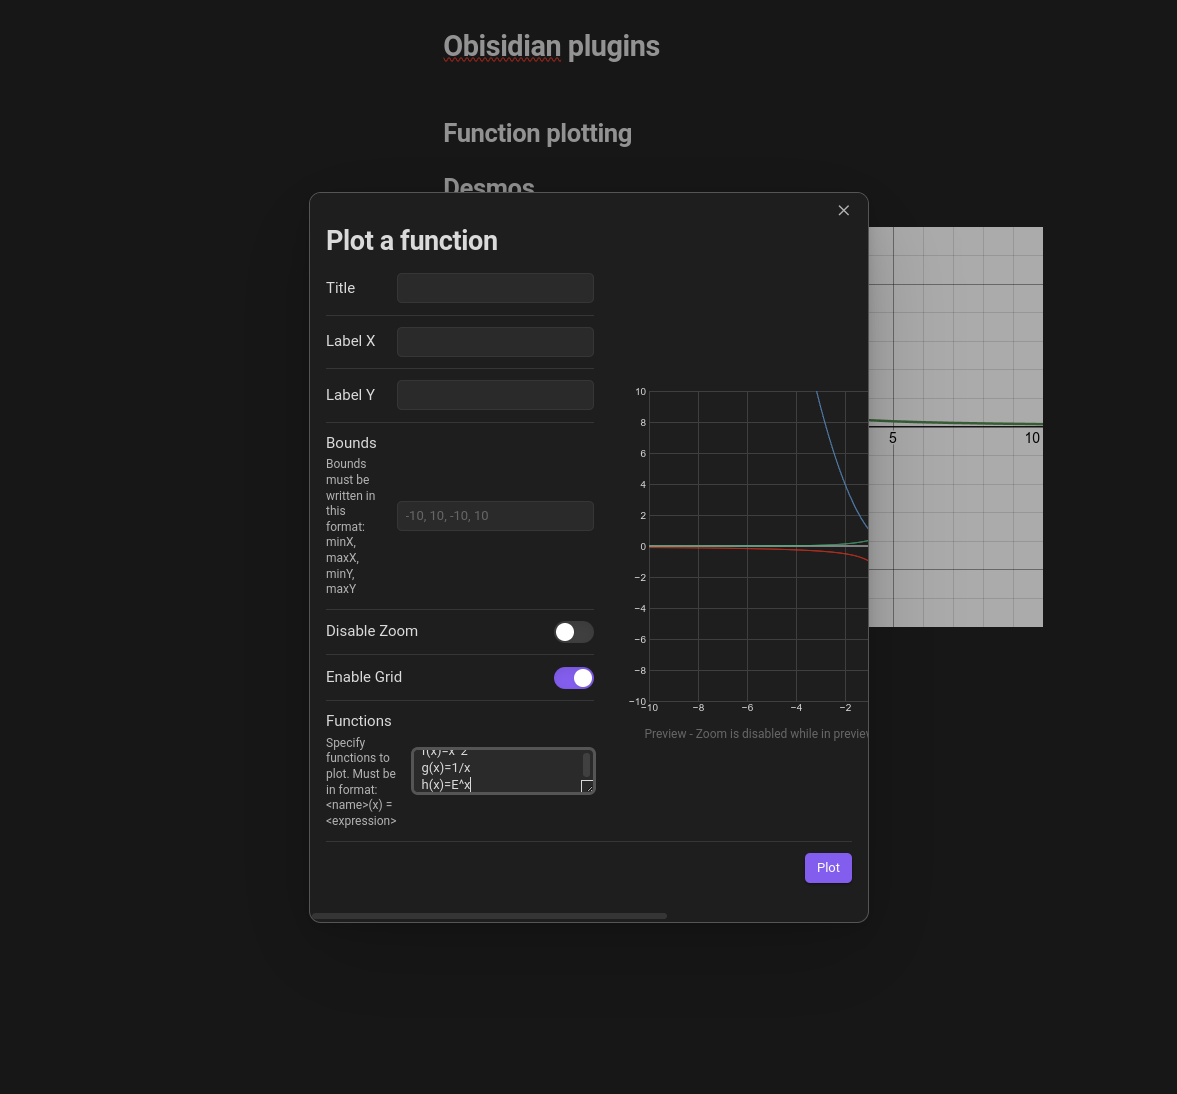
Obsidian Functionplot
also offers a plot creation dialog and provides interactive plots by default, both of which are features
Desmos
doesn't have. The decision between the two was quite hard, but with
Obsidian Functionplot
not having received an update in two years and it using JavaScript Math eval expressions to describe
functions, which I personally happen to heavily dislike, I gave the edge to
Desmos
in the end. It implements the whole set of LaTeX math functions and doesn't lack behind in any necessary
area - that's all the advantages I needed to hear...

Speaking of LaTeX math, I have to say that I still find the syntax of it non-ideal despite it being an
amazing and quite versatile typesetting system for mathematical expressions. This has mostly to do with
the length of many expressions and thus the time required to create them, which can become a major
bottleneck in lectures. Luckily enough, a fitting plugin to solve this problem exists called
Latex Suite
- it's almost like I'm not the only one with this problem. It doesn't change the way math blocks and
thus LaTeX math works in Obsidian in general, but provides you with a really well-made set of LaTeX
snippets, text expansions and editor enhancements. This manages to make the whole experience of typing
LaTeX much faster and more fluent, fixing basically my only gripe with math expressions. Nice.
Last but certainly not least, I want to shine some light on an extension called
Mermaid Tools
. In case you haven't heard about it before, Obsidian offers you the ability to easily create beautiful
diagrams and visualizations via a tool called Mermaid out-of-the-box. It uses a Markdown-inspired syntax
that's relatively straightforward and can be used by creating a code block once again and setting its
language to
mermaid
. Since there is quite a variety of available diagrams to create though, at least I personally don't
manage to remember the necessary keywords and syntax requirements for all of them and that's exactly
where
Mermaid Tools
comes into play. In a nutshell, it's an offline version of the Mermaid documentation on steroids with an
interactive user-interface that allows you to add all available elements of a chart type to your diagram
simply by clicking on their preview, thus greatly simplifying the effort required to create such
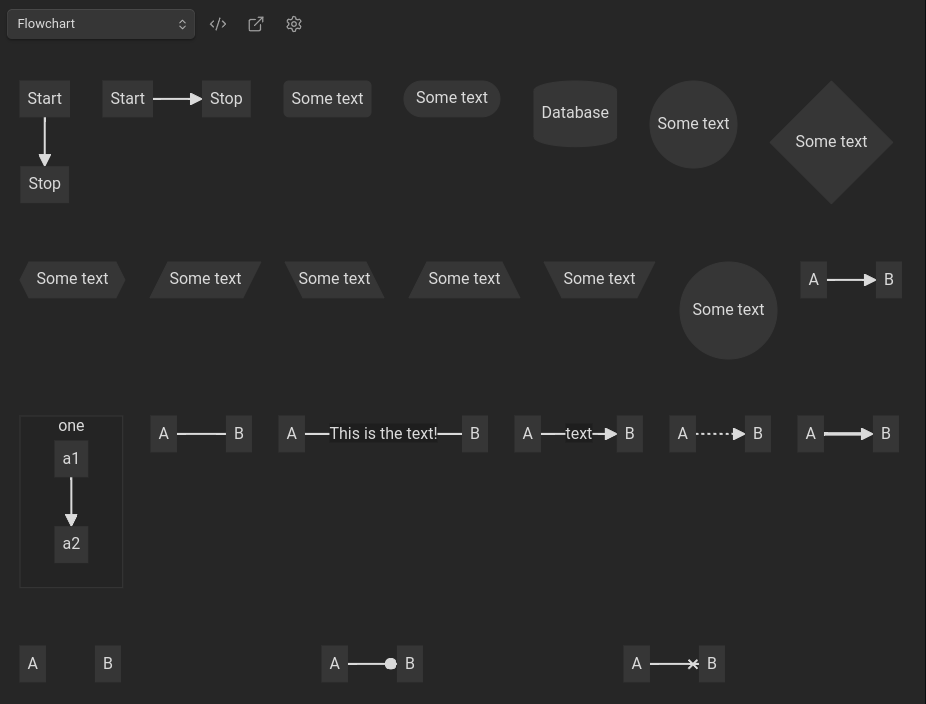
diagrams. To make this a bit easier to understand, here's a screenshot of all the elements available to
add to a flowchart:

With that said, I hope you were able to learn a thing or two, found this article helpful and most importantly enjoyed reading it. As always, feel free to share your thoughts and experiences in the comments down below and have a lovely day...